Sometimes the data come in, and you learn only that you understand less about your study system that you had ever realized. I’ve been poring through stable isotope data lately, and not everything is as expected.
Background
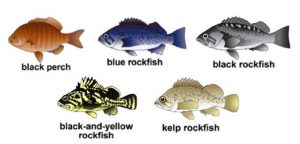
Before I talk about that, a bit of background. One of my dissertation chapters focuses on the kelp forest food web, and how trophic connections (e.g. species A eating species B) shift on a seasonal and annual basis. One of my major questions in this chapter addresses whether adult rockfish – the fish that we all love to watch while diving and that many of us love eat in tacos – tend to eat more juvenile fish in the spring and summer when juvenile rockfish recruit to the kelp forest. I’m focusing on four species of rockfish (Sebastes spp.), but also sample black surfperch (Embiotoca jacksoni) as a control species (a fish that NEVER eats fish regardless of the time of year). Species photo illustrations below are by Larry Allen (CSU Northridge).
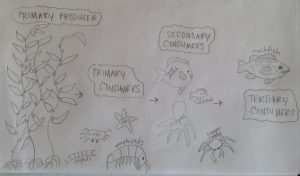
Before moving on, here’s a typical food web as I understand it in the kelp forest of central California (I know that my lack of artistic ability leaves something to be desired, but use your imagination).
What we know about what these fish eat
Black surfperch: amphipods! and other small crustaceans. What do amphipods and other tiny crustaceans eat? Algae, decaying algae, maybe even smaller crustaceans, phytoplankton.
Rockfish: any animal that they can fit in their mouth! OK, there are some nuances, but they are generalists meaning they eat a diverse group of prey items. Things like smaller fish, octopus, crabs, amphipods, jellies, brittle stars, shrimps, barnacles, urchins, the list goes on and on.
This information led me to the assumption that my four rockfish species would be eating approximately one trophic level higher than the black surfperch.
Nitrogen stable isotopes
The data in question here are stable isotope data. Stable isotopes (ring a bell from high school chemistry?) are a powerful method for understanding food web connections in nature. Though I won’t go into a full explanation, the important thing is that I can sample nitrogen stable isotopes to tell me the trophic level of a particular fish (i.e. how high on the food chain that fish eats). In my study, this translates to whether a fish is eating something that eats something that eats primary producers (making them a secondary consumer), eating secondary consumers (making them a tertiary consumer), or somewhere in between.
The plot that I’m confused about
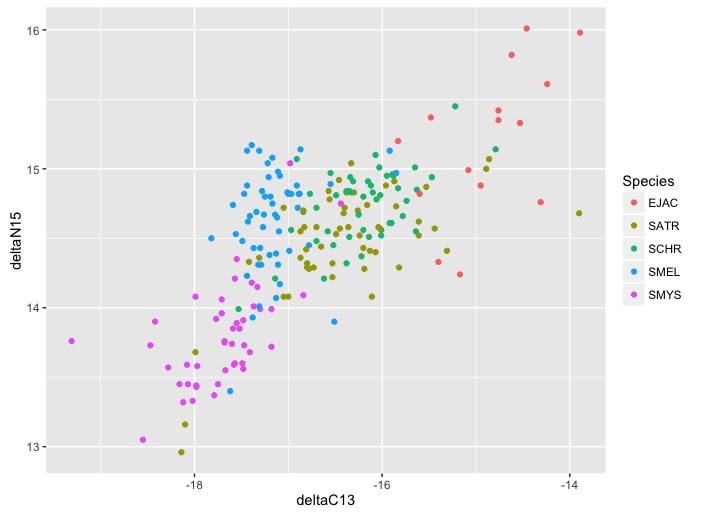
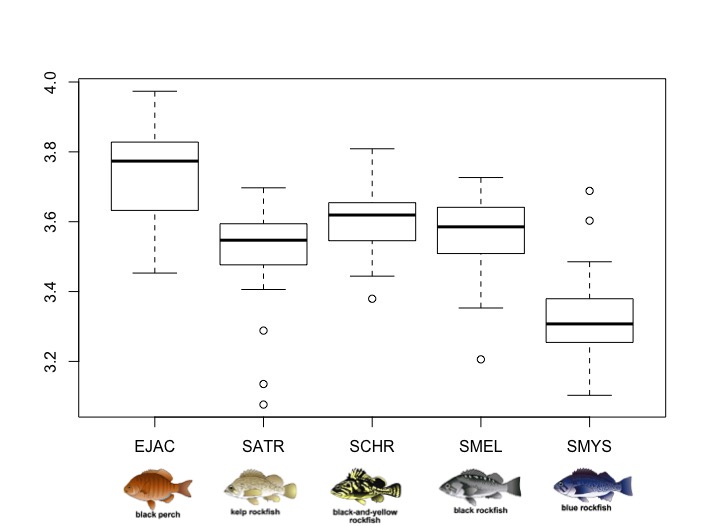
So, here’s the relevant data. On the 1st plot, each color represents one of the species pictured above, each point represents an individual fish that I sampled, and the vertical axis shows N stable isotope values. The second plot translates those N stable isotope values to trophic levels. As you can see, the black surfperch (that well-understood species that I used as a control) came out at a completely different trophic level than I expected – higher than all of the predatory rockfish!
Running Hypothesis
1. I screwed up my sampling, processing, analysis.
2. Because of the anomalous blog and El Nino ocean conditions happening during the years that I sampled, surfperch were eating their own offspring.
3. Surfperch prey on the eggs of other fish in the kelp forest.
4. Some of the amphipods that surfperch eat are actually scavengers that eat dead fish (meaning that they actually are eating higher on the food web than the fish).
Right now I’m exploring why surfperch are eating at a higher trophic level than rockfish. I’ve got help from several dedicated undergraduate techs who are combing through surfperch diet contents, and from Peter Slattery (MLML) who is identifying amphipods in the stomach contents to genus and teaching me about the feeding ecology of those amphipods.
If anyone has additional hypotheses for the unexpected high trophic level of black surfperch, send them my way!